When dealing with infrastructure or orchestration issues, Kubernetes Events are often very useful. However, by their nature, they are only stored 1h in the cluster and can be a bit painful to read with the command kubectl get events .
On this post i’ll quickly show an easy way to have them in some kind of centralized log/monitoring platform.
Note: this is just one simple way of doing it. There’s plenty of other solutions
Note 2: for the sake of reproductibility, i froze the helm package versions. Of course feel free to use the latest releases, but probably expect some fine tuning from your part
Step 1 - Install a k8s event logger
As stated in the name, we need a simple application that catches k8s events and log them in stdout. There’s plenty of solutions, often implementing by themself the logging to external platform such as OpenSearch.
I prefer to “separate the concerns” as much as possible, so i went with this simple solution : k8s-event-logger ( Kudos to the devs ! )
Install with Helm
helm repo add deliveryhero https://charts.deliveryhero.io/

helm install k8s-event-logger deliveryhero/k8s-event-logger -n monitoring --create-namespace --version=1.1.4
I install it in a namespace named “monitoring” but this can be changed without any impact for the following operations.
Step 2 - Setup Vector for log parsing/forwarding
Vector is, for me, the best replacement for the fluent* family :
- VRL remap language, which is (almost) runsafe, and allow to test your remapping
- Lot of built-in observability, especially prometheus metrics
- Low resources requirements
- Lots of included sources/output modules
However, even though in my experience it’s very stable at runtime, keep in mind that Vector is still under development and there’s yet no 1.X release ( at least when at moment of writing ), so use it at your own risks !
Configuring Vector to output into OpenSearch
We’ll install vector with helm too.
In this example, i’ll use OpenSearch as an output database. Here is a simple, documented, values.yaml file for that :
role: "Agent"

customConfig:
  data_dir: /vector-data-dir
  api:
    enabled: true
    address: 127.0.0.1:8686
    playground: false
  sources:
    kubernetes_events:
      type: kubernetes_logs
      # Select only the k8s-event-logger pod
      extra_label_selector: "app.kubernetes.io/name=k8s-event-logger"

  transforms:
    parse_k8s_events:
      inputs:
        - kubernetes_events
      type: remap
      source: |
		  # Remove useless fields. In this case, we are only interested
		  # about the output of the application, we don't want to monitor
		  # the pod itself
          del(.kubernetes)
          parsed, err = parse_json(string!(.message))
          if err != null {
            .log_parsing_error = err
          } else {
            . |= object!(parsed)
          }

  sinks:
    opensearch_k8s_events:
      type: elasticsearch
      inputs:
        - parse_k8s_events
      api_version: v8
      endpoints:
        - https://<my-opensearch-endpoint>
      compression: gzip
      # Should be deprecated, but in any case activate it for OpenSearch upgrades
      suppress_type_name: true
      bulk:
        index: "k8s-events_%Y.%m.%d"
Then you can run :
helm repo add vector https://helm.vector.dev
helm install vector vector/vector \
--namespace vector \
--create-namespace \
--values values.yaml \
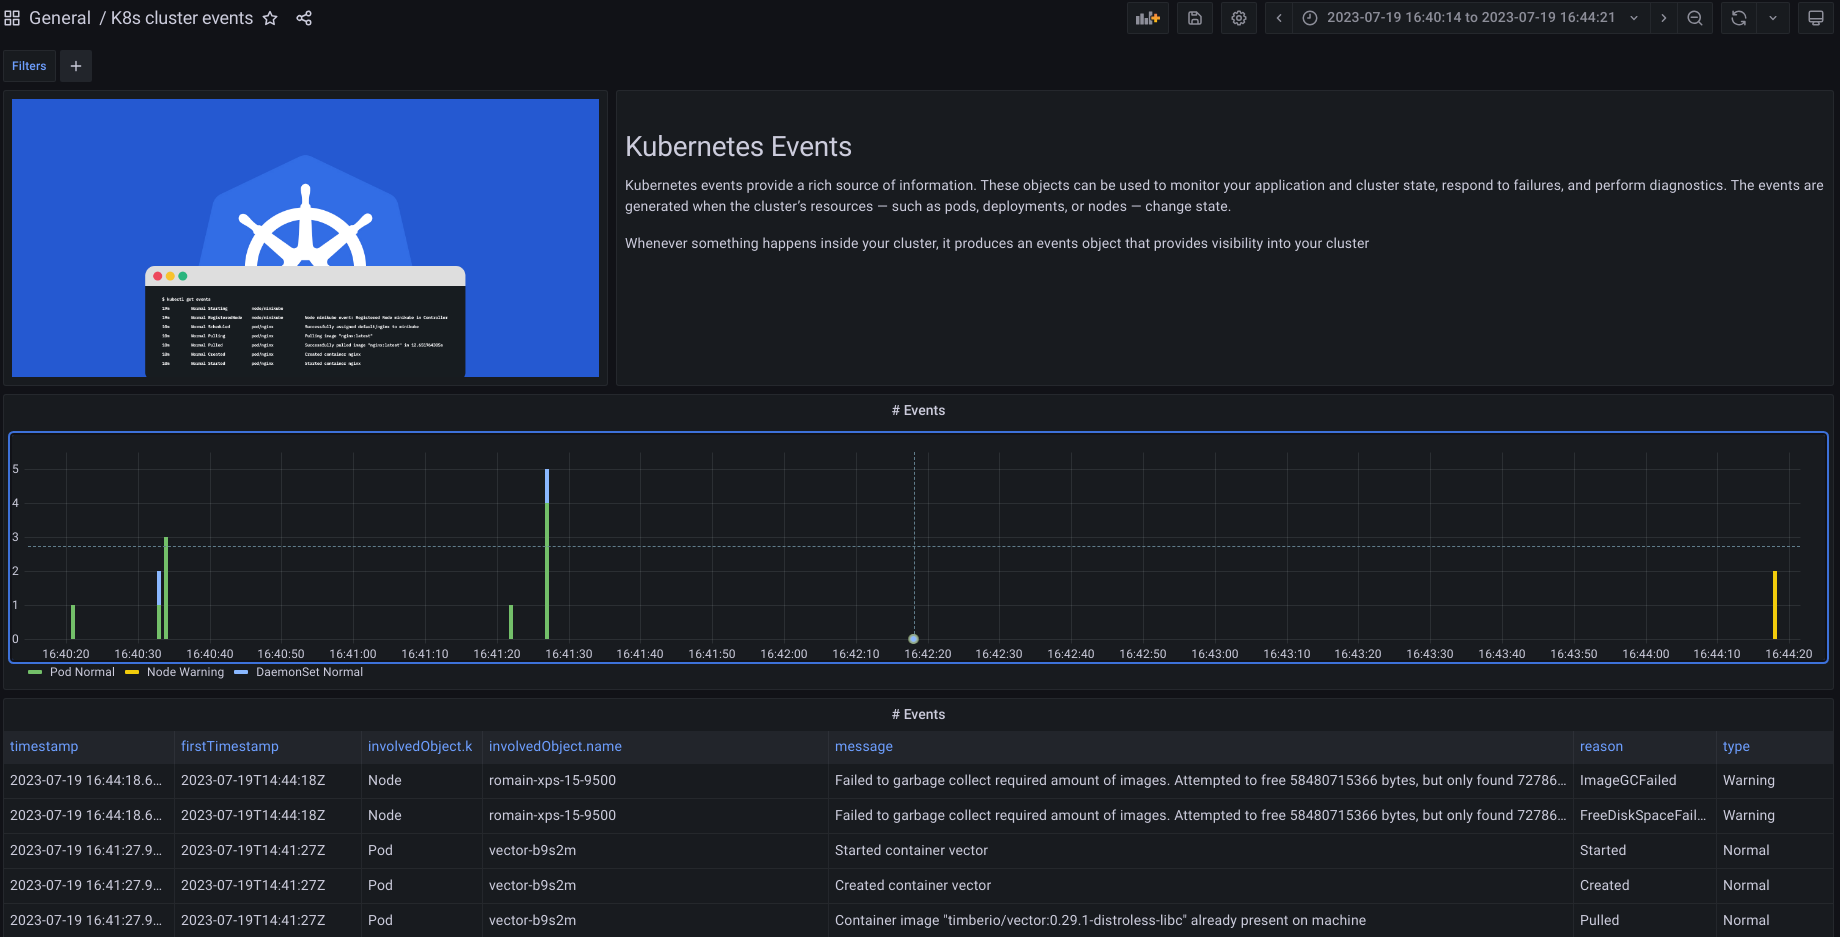
--version 0.21.1Step 3 - Visualizing in Grafana
Grafana offers a nice panel of visualization and very good integration with OpenSearch.
Here is a simple example panel, created in Grafana 10 :
{
"__inputs": [
{
"name": "DS_K8S_EVENTS OPENSEARCH",
"label": "K8S events Opensearc ",
"description": "",
"type": "datasource",
"pluginId": "elasticsearch",
"pluginName": "Elasticsearch"
}
],
"__elements": {},
"__requires": [
{
"type": "datasource",
"id": "elasticsearch",
"name": "Elasticsearch",
"version": "1.0.0"
},
{
"type": "grafana",
"id": "grafana",
"name": "Grafana",
"version": "9.5.2"
},
{
"type": "panel",
"id": "table",
"name": "Table",
"version": ""
},
{
"type": "panel",
"id": "text",
"name": "Text",
"version": ""
},
{
"type": "panel",
"id": "timeseries",
"name": "Time series",
"version": ""
}
],
"annotations": {
"list": [
{
"builtIn": 1,
"datasource": {
"type": "grafana",
"uid": "-- Grafana --"
},
"enable": true,
"hide": true,
"iconColor": "rgba(0, 211, 255, 1)",
"name": "Annotations & Alerts",
"type": "dashboard"
}
]
},
"editable": true,
"fiscalYearStartMonth": 0,
"graphTooltip": 0,
"id": null,
"links": [],
"liveNow": false,
"panels": [
{
"datasource": {
"type": "datasource",
"uid": "grafana"
},
"gridPos": {
"h": 8,
"w": 8,
"x": 0,
"y": 0
},
"id": 4,
"options": {
"code": {
"language": "plaintext",
"showLineNumbers": false,
"showMiniMap": false
},
"content": "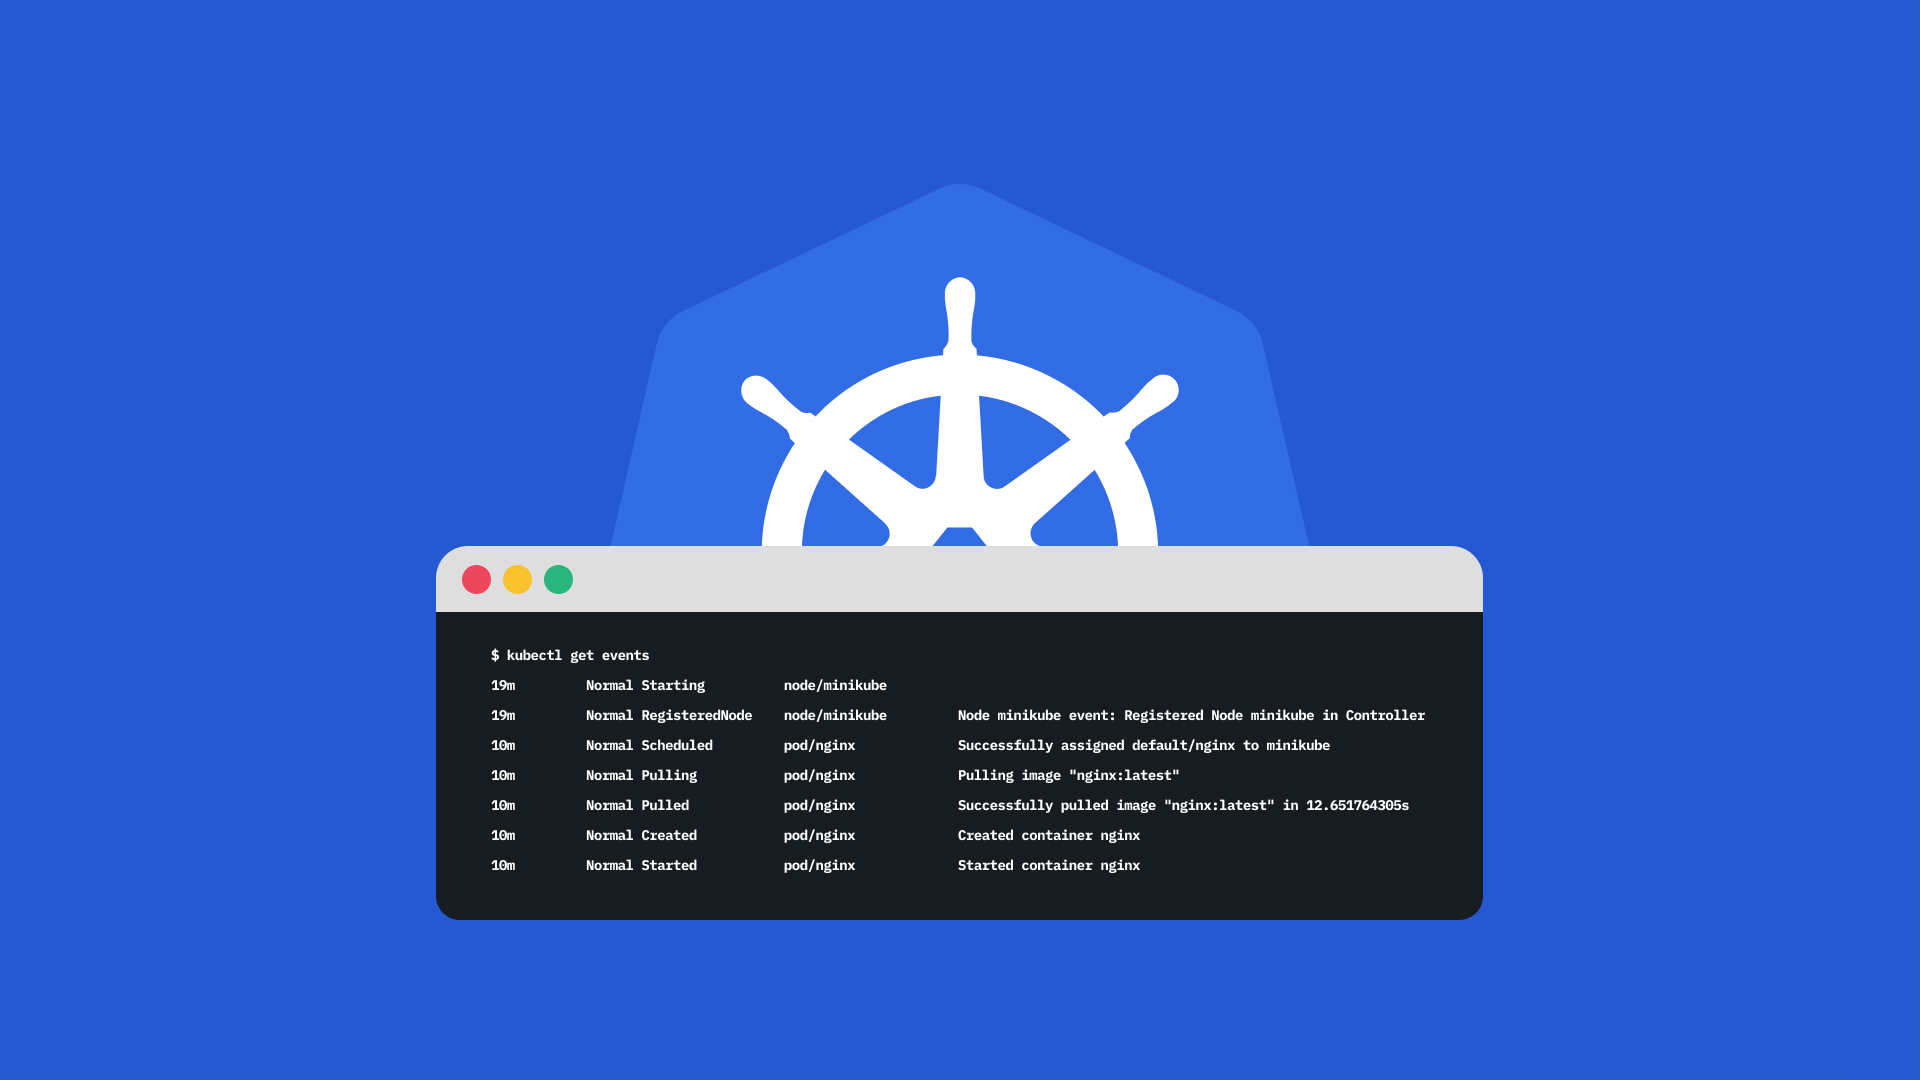",
"mode": "markdown"
},
"pluginVersion": "9.5.2",
"type": "text"
},
{
"datasource": {
"type": "datasource",
"uid": "grafana"
},
"gridPos": {
"h": 8,
"w": 16,
"x": 8,
"y": 0
},
"id": 3,
"options": {
"code": {
"language": "plaintext",
"showLineNumbers": false,
"showMiniMap": false
},
"content": "# Kubernetes Events\n\nKubernetes events provide a rich source of information. These objects can be used to monitor your application and cluster state, respond to failures, and perform diagnostics. The events are generated when the cluster’s resources — such as pods, deployments, or nodes — change state.\n\nWhenever something happens inside your cluster, it produces an events object that provides visibility into your cluster",
"mode": "markdown"
},
"pluginVersion": "9.5.2",
"title": " ",
"type": "text"
},
{
"datasource": {
"type": "elasticsearch",
"uid": "${DS_K8S_EVENTS OPENSEARCH}"
},
"fieldConfig": {
"defaults": {
"color": {
"mode": "palette-classic"
},
"custom": {
"axisCenteredZero": false,
"axisColorMode": "text",
"axisLabel": "",
"axisPlacement": "auto",
"barAlignment": 0,
"drawStyle": "bars",
"fillOpacity": 100,
"gradientMode": "none",
"hideFrom": {
"legend": false,
"tooltip": false,
"viz": false
},
"lineInterpolation": "linear",
"lineWidth": 0,
"pointSize": 5,
"scaleDistribution": {
"type": "linear"
},
"showPoints": "auto",
"spanNulls": false,
"stacking": {
"group": "A",
"mode": "normal"
},
"thresholdsStyle": {
"mode": "off"
}
},
"mappings": [],
"thresholds": {
"mode": "absolute",
"steps": [
{
"color": "green",
"value": null
},
{
"color": "red",
"value": 80
}
]
}
},
"overrides": []
},
"gridPos": {
"h": 8,
"w": 24,
"x": 0,
"y": 8
},
"id": 1,
"maxDataPoints": 200,
"options": {
"legend": {
"calcs": [],
"displayMode": "list",
"placement": "bottom",
"showLegend": true
},
"tooltip": {
"mode": "single",
"sort": "none"
}
},
"targets": [
{
"alias": "",
"bucketAggs": [
{
"field": "involvedObject.kind.keyword",
"id": "3",
"settings": {
"min_doc_count": "1",
"order": "desc",
"orderBy": "_term",
"size": "10"
},
"type": "terms"
},
{
"field": "type.keyword",
"id": "4",
"settings": {
"min_doc_count": "1",
"order": "desc",
"orderBy": "_term",
"size": "10"
},
"type": "terms"
},
{
"field": "timestamp",
"id": "2",
"settings": {
"interval": "auto"
},
"type": "date_histogram"
}
],
"datasource": {
"type": "elasticsearch",
"uid": "${DS_K8S_EVENTS OPENSEARCH}"
},
"metrics": [
{
"id": "1",
"type": "count"
}
],
"query": "",
"refId": "A",
"timeField": "timestamp"
}
],
"title": "# Events",
"type": "timeseries"
},
{
"datasource": {
"type": "elasticsearch",
"uid": "${DS_K8S_EVENTS OPENSEARCH}"
},
"fieldConfig": {
"defaults": {
"color": {
"fixedColor": "text",
"mode": "fixed"
},
"custom": {
"align": "auto",
"cellOptions": {
"type": "color-text"
},
"inspect": true
},
"mappings": [],
"thresholds": {
"mode": "absolute",
"steps": [
{
"color": "green",
"value": null
},
{
"color": "red",
"value": 80
}
]
}
},
"overrides": [
{
"matcher": {
"id": "byName",
"options": "message"
},
"properties": [
{
"id": "custom.width",
"value": 745
}
]
},
{
"matcher": {
"id": "byName",
"options": "involvedObject.kind"
},
"properties": [
{
"id": "custom.width",
"value": 121
}
]
},
{
"matcher": {
"id": "byName",
"options": "type"
},
"properties": [
{
"id": "color",
"value": {
"fixedColor": "semi-dark-purple",
"mode": "fixed"
}
}
]
},
{
"matcher": {
"id": "byName",
"options": "firstTimestamp"
},
"properties": [
{
"id": "custom.width",
"value": 187
}
]
},
{
"matcher": {
"id": "byName",
"options": "timestamp"
},
"properties": [
{
"id": "custom.width",
"value": 171
}
]
},
{
"matcher": {
"id": "byName",
"options": "involvedObject.name"
},
"properties": [
{
"id": "custom.width",
"value": 346
}
]
}
]
},
"gridPos": {
"h": 14,
"w": 24,
"x": 0,
"y": 16
},
"id": 2,
"maxDataPoints": 200,
"options": {
"cellHeight": "sm",
"footer": {
"countRows": false,
"fields": "",
"reducer": [
"sum"
],
"show": false
},
"showHeader": true,
"sortBy": []
},
"pluginVersion": "9.5.2",
"targets": [
{
"alias": "",
"bucketAggs": [],
"datasource": {
"type": "elasticsearch",
"uid": "${DS_K8S_EVENTS OPENSEARCH}"
},
"metrics": [
{
"id": "1",
"settings": {
"size": "500"
},
"type": "raw_data"
}
],
"query": "",
"refId": "A",
"timeField": "timestamp"
}
],
"title": "# Events",
"transformations": [
{
"id": "filterFieldsByName",
"options": {
"include": {
"names": [
"timestamp",
"firstTimestamp",
"involvedObject.kind",
"involvedObject.name",
"message",
"type",
"reason"
]
}
}
},
{
"id": "renameByRegex",
"options": {}
}
],
"type": "table"
}
],
"refresh": "",
"schemaVersion": 38,
"style": "dark",
"tags": [],
"templating": {
"list": [
{
"datasource": {
"type": "elasticsearch",
"uid": "a0e68809-cf06-48b4-97a5-bda7ccb9f3a3"
},
"filters": [],
"hide": 0,
"name": "Filters",
"skipUrlSync": false,
"type": "adhoc"
}
]
},
"time": {
"from": "now-3h",
"to": "now"
},
"timepicker": {},
"timezone": "",
"title": "K8s cluster events",
"uid": "b037d817-6d9d-4a56-af33-663bdf510423",
"version": 3,
"weekStart": ""
}This very simple dashboards allows you to easily read and filter the kubernetes events
I hope this small article will make your k8s monitoring easier !